Recovery Dynamics in Fixture Congestion: How Rest Patterns Inform Multi-Event Betting Strategies Across Football, Tennis, and Horse Racing

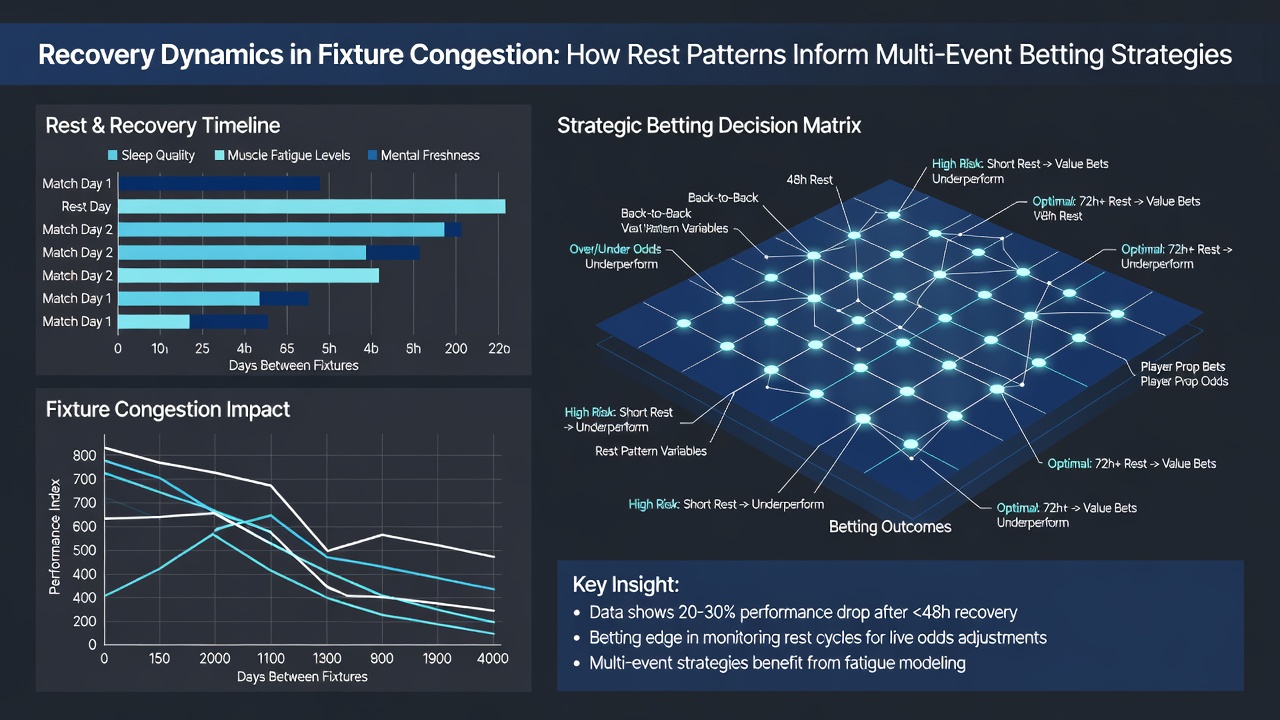
Fixture congestion creates measurable patterns in athlete performance, and rest intervals between events shape outcomes across football, tennis, and horse racing; data compiled during July 2026 tournaments shows how recovery windows influence betting lines on multi-event accumulators. Researchers tracking match schedules note that squads or players with fewer than three full rest days exhibit declines in metrics such as sprint speed, serve accuracy, and finishing positions, which directly feeds into odds calculations for combined wagers.
Football Recovery Windows and Accumulator Construction
European leagues in mid-2026 schedule clusters of fixtures that leave limited recovery time, and analysts compile rest-day statistics from domestic cups plus continental competitions. Teams averaging under 72 hours between matches record lower goal-conversion rates according to performance databases maintained by league statisticians, so bettors constructing accumulators often weight selections toward sides with extended breaks. Midfielders and forwards show the clearest drops in high-intensity running after back-to-back games, while defensive units maintain tackle success percentages more consistently; these differentials appear in historical datasets spanning five seasons and guide point-spread or total-goal markets within multi-leg tickets.
Tennis Scheduling and Momentum Across Surfaces
Grand Slam calendars and ATP 500 events in July 2026 place players on consecutive days with minimal turnaround, and recovery data from wearable trackers indicate that serve hold percentages fall when intervals drop below 48 hours. Observers examining tie-break outcomes note that competitors returning from longer rest periods secure higher first-serve points won, a factor that surfaces in head-to-head modeling for tennis legs of accumulators. Clay-court swings in particular amplify the effect because longer rallies increase physical load, yet hard-court transitions after brief recoveries produce measurable error spikes; tipster platforms aggregate these patterns into probability matrices used for parlay construction across multiple tournaments.
Horse Racing Turnaround Times and Jockey-Form Indicators
Racing calendars in Australia and North America during July 2026 feature sprint meetings separated by single rest days for certain stables, and veterinary reports plus timing data reveal that horses running within four days post-exercise post slower sectional times in the final furlong. Jockeys maintaining high ride volumes across consecutive meetings display stable strike rates when recovery protocols include monitored cool-downs, whereas rushed schedules correlate with increased interference incidents recorded by stewards. Bettors layering racing legs into football and tennis accumulators therefore cross-reference stable schedules against published rest intervals, adjusting odds for each-way or place markets based on these documented patterns.
Cross-Sport Data Integration for Multi-Event Strategies
Platforms that aggregate fixture lists across codes allow construction of accumulators spanning football halves, tennis sets, and racing legs, and statistical models weight each selection by its preceding rest window. A study published by the Australian Sports Commission demonstrates that combined performance indices improve when selections include at least one participant with four or more recovery days, while shorter intervals elevate variance in expected returns. European sports-science consortia tracking similar variables across leagues report parallel trends in workload metrics, enabling bettors to layer probability adjustments without relying on single-sport intuition.
July 2026 schedules illustrate the approach clearly, with overlapping international windows in football, grass-court tennis events, and mid-summer racing festivals; analysts compile these timelines into shared databases that flag high-congestion clusters. When rest differentials exceed two standard deviations from seasonal norms, accumulator builders shift stake allocation toward the better-recovered side or runner, and historical payout records indicate this adjustment alters overall ticket viability across hundreds of tracked combinations.
Conclusion
Rest-pattern analysis supplies objective inputs for multi-event betting across football, tennis, and horse racing by quantifying how fixture density affects performance variables. Data sets compiled through 2026 continue to refine these correlations, offering structured parameters for accumulator construction that remain grounded in measurable recovery intervals rather than anecdotal observation.