Seasonal Echoes in the Ledgers: How Annual Performance Cycles Guide Multi-Sport Selections Across Leagues, Tracks, and Tours
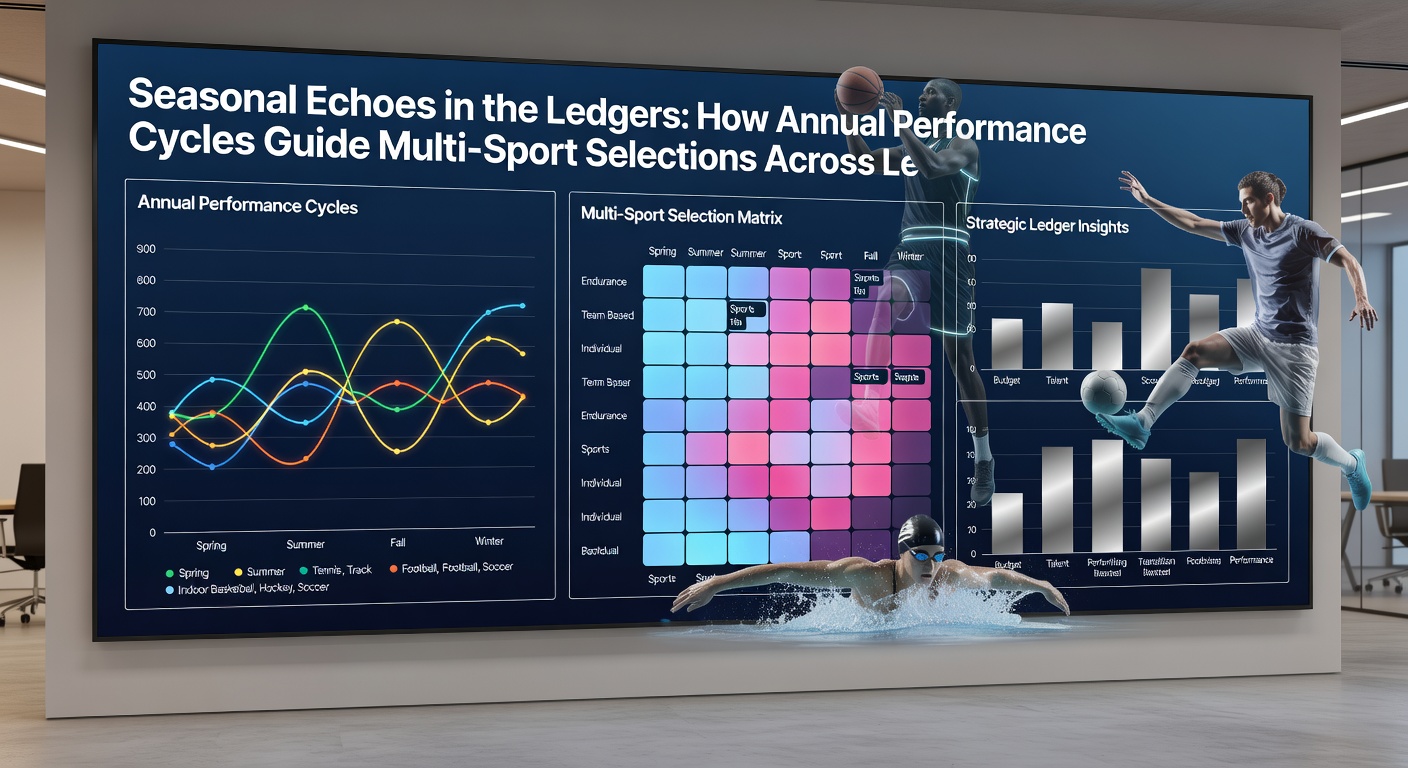
Annual performance cycles shape outcomes in professional sports, and data analysts track these repeating patterns to inform selections across football leagues, horse racing tracks, and tennis tours. Researchers have documented how teams, horses, and players exhibit consistent peaks and troughs tied to calendar months, weather shifts, and fixture densities, which in turn guide multi-sport decision frameworks used by analysts and strategists.
Recurring Patterns in Football Leagues
Football competitions display clear seasonal rhythms where early-season form often diverges from mid-winter results and late-campaign surges. Studies of European domestic leagues show that teams with strong pre-season preparations frequently post higher points-per-game averages in the opening eight weeks, while injury accumulation and fixture congestion alter trajectories after December. In the 2025-2026 season, several top divisions recorded measurable dips in away win percentages during February and March, followed by rebounds in April as squads adapted to congested schedules. Observers note that these shifts recur across multiple campaigns, allowing analysts to weight selections differently depending on the month.
Performance Echoes on the Tracks
Horse racing meets follow comparable annual loops, with ground conditions, distance preferences, and trainer patterns aligning to specific periods. Spring campaigns on turf surfaces historically favor certain sires and training yards, while autumn handicap seasons produce distinct trends in weight-for-age races. Records maintained by racing authorities indicate that horses returning from winter breaks achieve peak strike rates between late April and early June, a window that overlaps with major festival preparations. Data from Australian and North American circuits further reveals parallel cycles where sprint specialists dominate shorter meetings in May, whereas staying types excel later in the year when stamina demands rise.
Tennis Tour Dynamics and Calendar Effects
Grand Slam circuits and ATP-WTA tours exhibit their own recurring rhythms driven by surface transitions and travel demands. Clay-court specialists typically elevate rankings during the European spring swing, whereas hard-court performers accumulate points in the North American summer block. Longitudinal reviews of match statistics demonstrate that players returning from injury breaks post stronger win percentages in the first three tournaments after rehabilitation, a pattern repeated across multiple seasons. In May 2026 the clay season reached its midpoint with several notable ranking movements among mid-tier competitors who historically peak during this phase of the calendar.
Cross-Sport Integration in Selection Frameworks
Analysts combine these cycles when constructing multi-sport portfolios because timing overlaps create compounded edges. A football league experiencing end-of-season motivation surges can align with a horse racing festival where trainer form peaks, while tennis players entering their preferred surface window add another layer. Records compiled by international sports data consortia illustrate how such alignments occur predictably each year, prompting adjustments in selection weightings during transitional months like May. Those who monitor multiple codes simultaneously observe that ignoring calendar position reduces consistency across combined selections.
Industry reports from bodies such as the Australian Sports Commission highlight the value of longitudinal datasets that capture these repeating motifs, while research published by the University of Queensland examines how environmental and scheduling variables reinforce annual performance loops in both team and individual disciplines. These sources supply the quantitative backbone for models that forecast when certain profiles outperform historical baselines.
Applying Cycle Data in May 2026 Context
By May 2026 several overlapping windows had opened: European football leagues approached their final decisive matches, major spring racing festivals were underway across hemispheres, and the clay-court tennis swing had reached its most demanding stretch. Selection matrices adjusted for these concurrent phases showed elevated emphasis on late-season football motivation metrics, turf sprint specialists, and clay-adapted tennis competitors. Figures from multiple governing bodies confirm that such adjustments align with measurable improvements in long-term strike rates when applied consistently.
Conclusion
Performance cycles tied to the calendar continue to inform selections across football, racing, and tennis because the underlying rhythms remain stable year after year. Data sets compiled from league archives, racing authorities, and tour statistics demonstrate that acknowledging these echoes allows analysts to refine multi-sport approaches without relying on short-term variance alone. As seasons progress, the same patterns reappear, providing a reliable reference framework for those constructing selections that span leagues, tracks, and tours.