Weather-Driven Variables and Their Impact on Multi-Event Outcome Forecasts in League Play and Equine Events
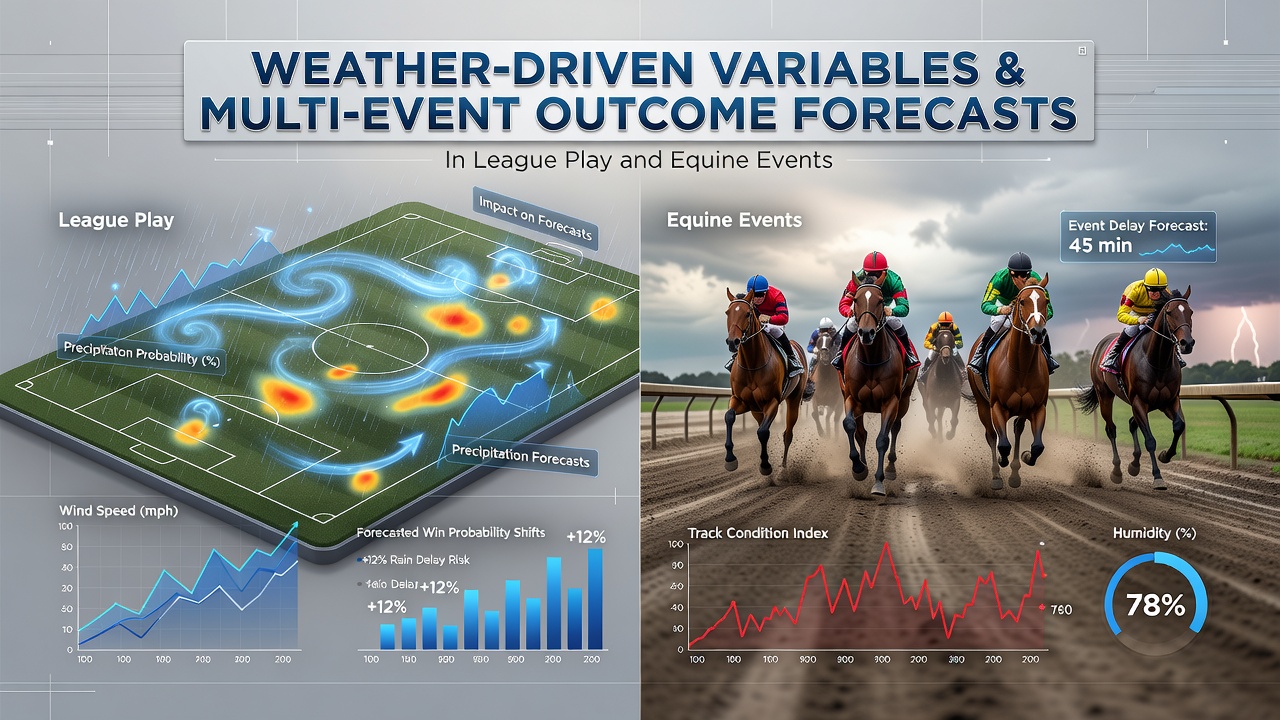
Weather patterns shape outcomes across league competitions and equine races in measurable ways that forecasters track through specific variables, and these elements combine to alter performance metrics when multiple events unfold over a single day or weekend. Temperature shifts, wind speeds, precipitation levels, and humidity readings each register distinct effects on player stamina in team leagues while simultaneously changing track surfaces for horses, so integrated forecast models must account for both domains when building multi-event projections.
Core Weather Variables in League Competitions
League play in outdoor sports registers direct responses to atmospheric conditions, and data compiled by national meteorological services shows that sustained winds above 15 kilometers per hour increase error rates in passing and kicking accuracy by measurable margins. High humidity combined with temperatures exceeding 28 degrees Celsius accelerates fatigue markers in athletes, which researchers document through heart-rate recovery times and sprint-velocity declines across consecutive matches. Precipitation alters ball grip and field traction, and studies conducted by the Australian Bureau of Meteorology indicate that even light rain reduces shot precision in field-based team events by altering surface friction coefficients.
Forecasters therefore integrate real-time sensor readings into outcome models because isolated variables rarely act alone. When wind and temperature interact during evening fixtures, cooling effects compound dehydration risks, and analysts adjust probability matrices accordingly for chained event sequences.
Equine Performance Under Variable Conditions
Horse racing surfaces respond rapidly to moisture and temperature gradients, and track management records demonstrate that turf firmness ratings shift from firm to good-to-soft within two hours of moderate rainfall. Equine athletes exhibit stride-length reductions on softer ground, and veterinary monitoring programs coordinated through the International Equestrian Federation have quantified these changes through force-plate measurements that link ground compliance to energy expenditure.
July 2026 schedules across major racing circuits include several high-profile meetings where forecasters expect variable cloud cover and intermittent showers, and these conditions historically widen finishing margins because horses with proven wet-track pedigrees post statistically higher place rates. Humidity levels above 70 percent also influence respiratory recovery between races, which multi-event modeling incorporates when projecting cumulative fatigue across an afternoon card.
Integrated Forecasting for Multi-Event Sequences
Outcome forecasts spanning both league fixtures and equine races require synchronized meteorological inputs because weather systems move across regions and affect separate venues on the same schedule. Numerical weather prediction outputs from agencies such as the National Oceanic and Atmospheric Administration supply hourly resolution data that sports analysts merge with historical performance databases. The resulting hybrid models adjust base probabilities for each leg of an accumulator-style sequence when precipitation probability exceeds 40 percent or when wind gusts surpass venue-specific thresholds.
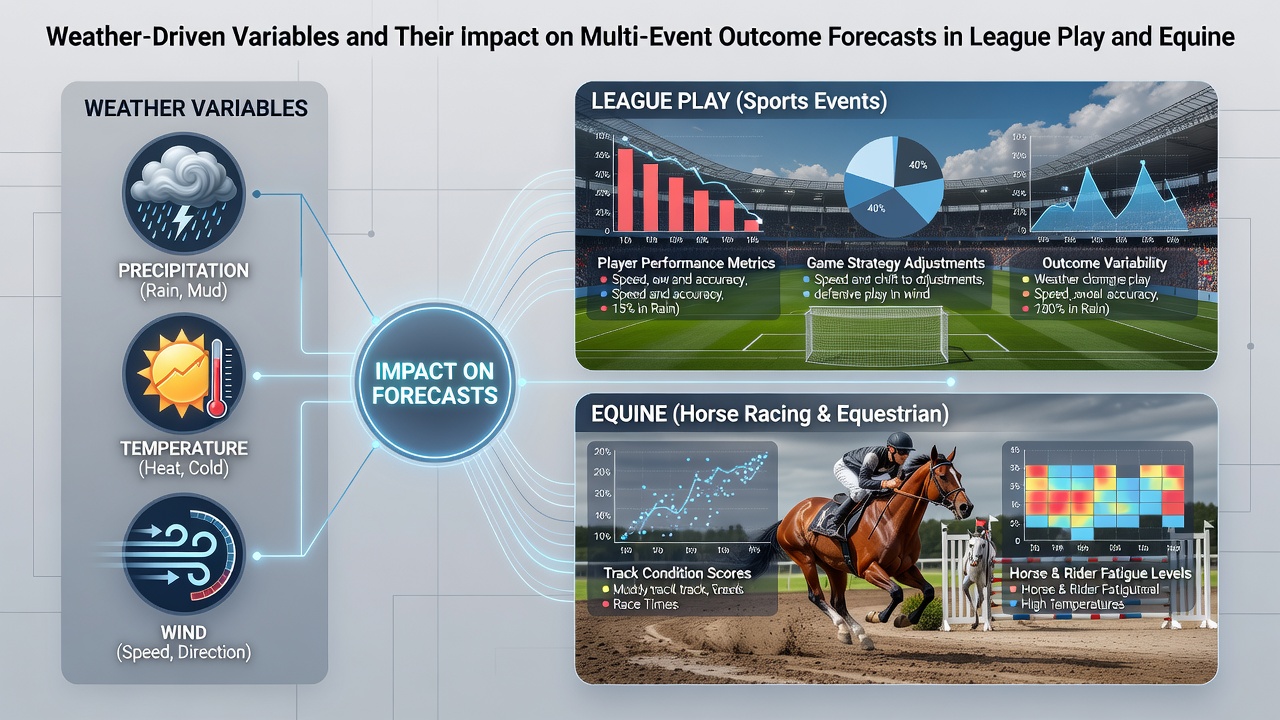
Cross-sport correlation matrices reveal that certain weather signatures produce parallel effects in team and equine contexts. Persistent drizzle, for example, simultaneously slows grass-court tennis rallies and softens racing turf, and analysts therefore apply directional adjustments that compound across linked selections rather than treating each event in isolation.
Data Sources and Model Refinement
Long-term climatological records maintained by Environment and Climate Change Canada supply baseline distributions for temperature and precipitation that modelers calibrate against recent event logs. Academic teams at universities in the European Union have published peer-reviewed papers that validate the inclusion of dew-point temperature as an additional predictor for both athlete hydration status and equine respiratory load. These layered datasets allow iterative refinement of forecast skill scores, and verification studies conducted after major tournament clusters show improved accuracy when all four primary variables receive simultaneous weighting.
Real-time assimilation of on-site anemometer and soil-moisture readings further tightens error bounds for afternoon and evening events, and operational centers now distribute updated bulletins every three hours during active competition windows.
Conclusion
Weather-driven variables exert quantifiable influence on both league-play statistics and equine-event results, and multi-event outcome forecasts gain precision when analysts incorporate temperature, wind, precipitation, and humidity data into unified modeling frameworks. Continued integration of high-resolution meteorological inputs with performance archives supports ongoing improvement in projection reliability across combined schedules.